The Butterfly Effect: How Small Changes Create Big Results
Have you heard of the “Butterfly Effect”? It’s the fascinating idea that tiny causes, like a butterfly flapping its wings in Brazil, can trigger massive effects, like a tornado in Texas. This concept emerged from a groundbreaking scientific paper published about 50 years ago, and it has captured the public imagination like few other scientific concepts. Just check IMDB – you’ll find numerous movies, TV episodes, and short films named after it, not to mention its prominent appearances in blockbusters like Jurassic Park. And let’s not forget the countless memes it has spawned!

Why are we so captivated by the Butterfly Effect? Perhaps because it addresses a fundamental question: How well can we predict the future?
Turn back the clock to the late 1600s, after Isaac Newton formulated his laws of motion and universal gravitation. The world seemed perfectly predictable then. Scientists could explain the motions of planets and moons, predict eclipses, and forecast the appearances of comets with remarkable accuracy centuries in advance. The future appeared to be fixed – we just had to wait for it to unfold.
Enter Edward Lorenz, the father of modern chaos theory. In the 1960s, this meteorologist revolutionized our understanding of chaos through a simple computer simulation of Earth’s atmosphere. His model used 12 equations with 12 variables, including temperature, pressure, and humidity. The computer would print each time step as a row of numbers, showing how these variables changed over time.
Lorenz’s breakthrough came from an unexpected source: a shortcut. When he wanted to rerun a simulation, he entered numbers from halfway through a previous printout. What he discovered was astonishing – the new run followed the old one briefly before diverging dramatically, eventually describing a completely different atmospheric state. The culprit? The printer rounded numbers to three decimal places, while the computer calculated with six. This tiny difference – less than one part in a thousand – created entirely different weather patterns in the short term. Fascinated by this discovery, Lorenz simplified his equations repeatedly until he arrived at just three equations with three variables:
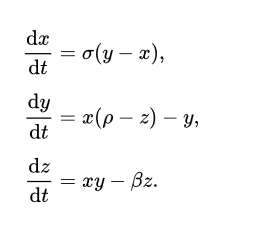
These equations, which can be implemented in R code like this:
# Specify the three equations
lorenz_equations <- function(dt, state, parameters) {
  with(as.list(c(state, parameters)), {
    dx <- sigma * (y - x)
    dy <- x * (rho - z) - y
    dz <- x * y - beta * z
    list(c(dx, dy, dz))
  })
}

# Solve with initial condition
lorenz_solve <- function(y, dt, params) {
  as.data.frame(
    deSolve::ode(y = y, times = dt,
                 func = lorenz_equations,
                 parms = params,
                 method = "ode45")
  )
}

# Specify constants which came directly from Wiki
constants <- c(sigma = 10, beta = 8/3, rho = 28)
Lorenz’s system demonstrated what we now call “sensitive dependence on initial conditions” – the foundation of chaos theory.
# Times over which the equations are numerically solved
times <- seq(0, 25, 0.01)

# Initial conditions, in the order x, y, z vectors
state <- c(x = 2, y = 3, z = 4)
state_next <- c(x = 2, y = 3, z = 4.1)

# Solve the diffrential equations
solution_a <- lorenz_solve(state, times, constants)
solution_b <- lorenz_solve(state_next, times, constants)
solution_a$initialization <- "(2,3,4)"
solution_b$initialization <- "(2,3,4.1)"
When we plot this system in 3D, something magical happens. Using initial conditions like (2,3,4) and (2,3,4.1), we get a stunning visualization:

The resulting pattern, coincidentally, resembles a butterfly. But what’s truly remarkable is that the system never exactly repeats itself. This is chaos in action – any tiny difference in initial conditions, no matter how small, gets amplified into dramatically different outcomes.
Think about starting with multiple different initial conditions and watching them evolve. At first, the motion appears chaotic, but soon all points gravitate toward an attractor. These paths never cross or form loops – if they did, the behavior would become periodic and predictable. Instead, each path traces an infinite curve in a finite space. How is this possible? The answer lies in fractals!
The science behind the Butterfly Effect reveals a profound and beautiful structure underlying chaos. In Lorenz’s equations, this structure takes the shape of a butterfly. So, how well can we predict the future? Not very well at all. The further ahead we try to predict, the harder it becomes, until our predictions become no better than guesses.
If you’re interested in exploring further, you can find the source code on GitHub repo or dive deeper into the Wikipedia page about the Lorenz’s system.
NOTE: If you discover any mistakes or want to offer feedback, please feel free to email me.