Creating a Mathematical Marigold for the Valentine’s Day
R isn’t just for serious data analysis - it can create stunning visual art. After exploring fractals in my previous projects (Julia Sets, Barnsley’s Fern, and Mandelbrot Set), I decided to craft a special marigold flower for Valentine’s Day using mathematical patterns found in nature.
A rather short source code for this post can be found on my GitHub repository.
Nature’s Mathematical Beauty
Plants follow a fascinating mathematical principle called Phyllotaxis in arranging their leaves and petals. This is just one example of mathematics in nature, alongside snowflake patterns and the fractal geometry of romanesco broccoli.
Building the Flower
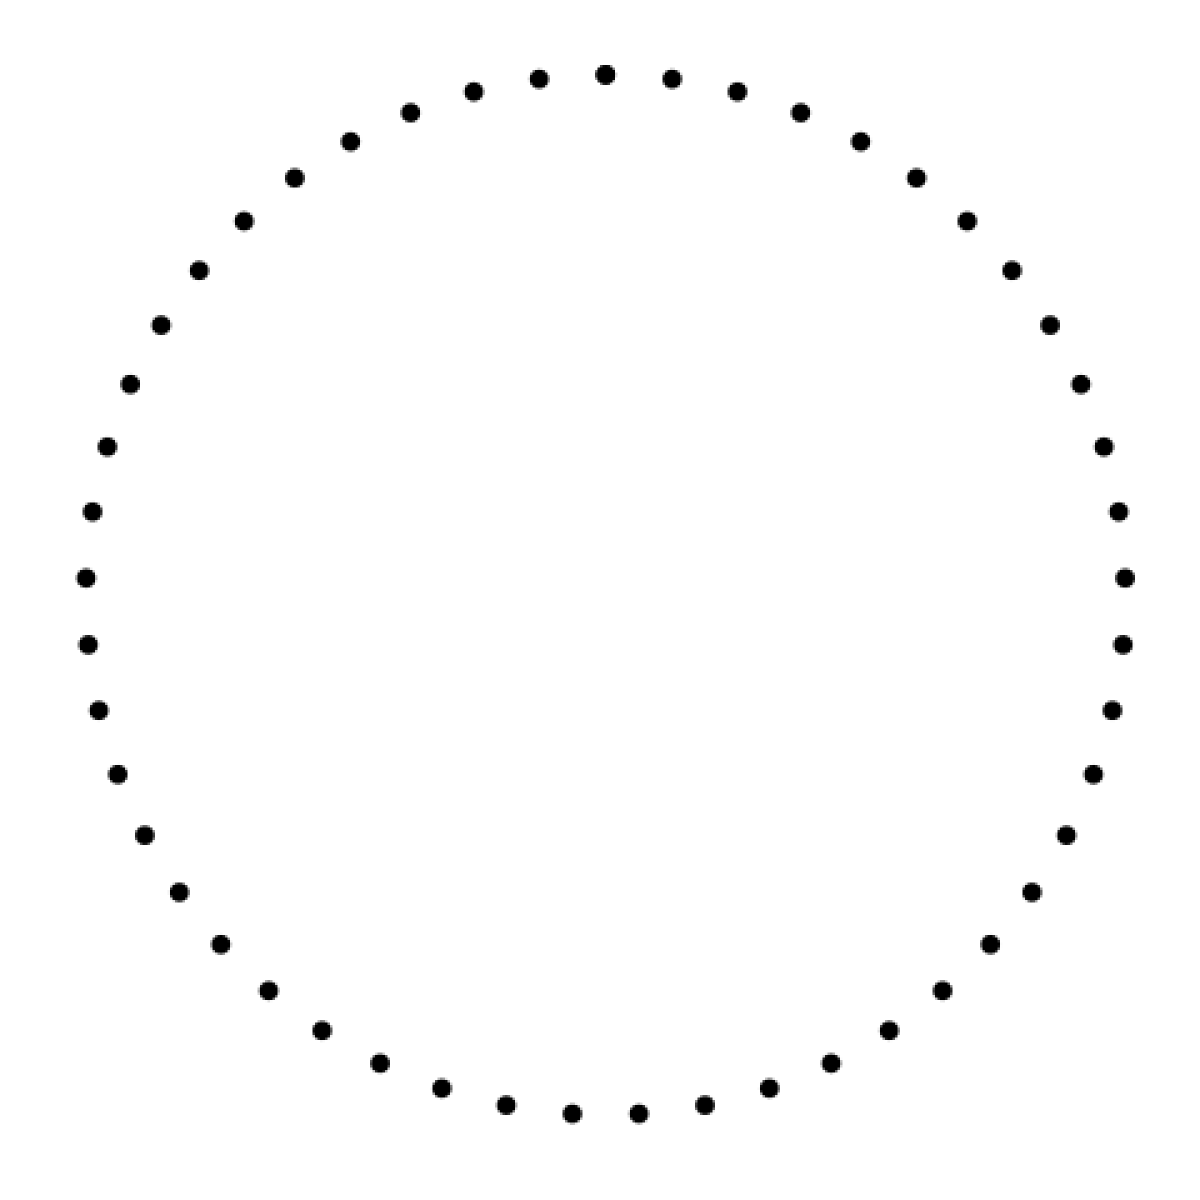
- Start with a unit circle (where x² + y² = 1):
- Apply the
Golden Angle - π(3 − √5)- to create spiral patterns: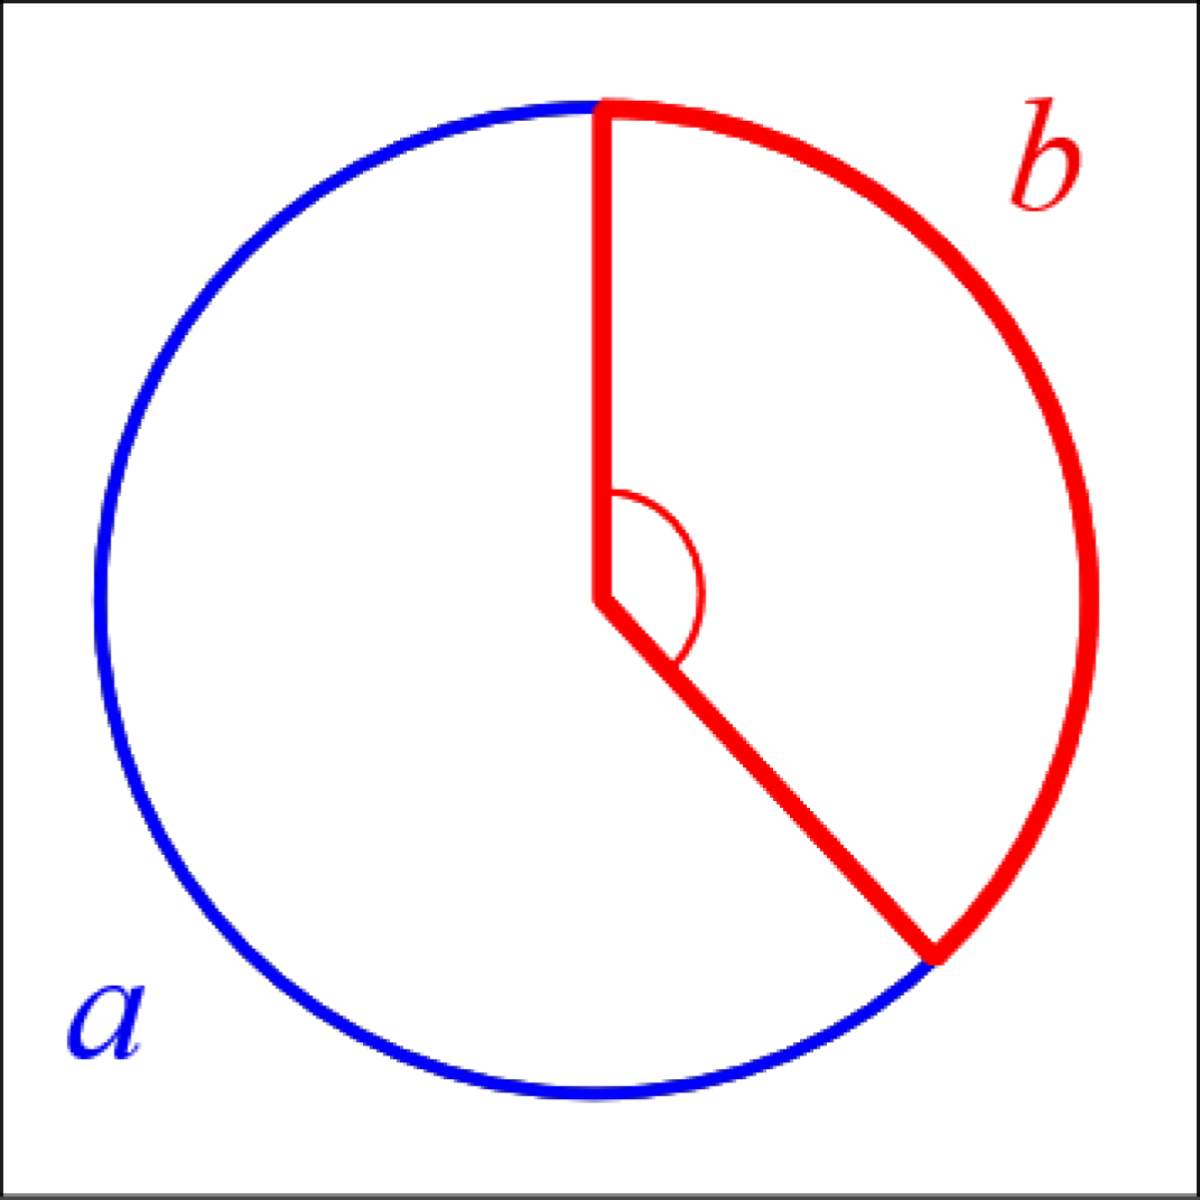
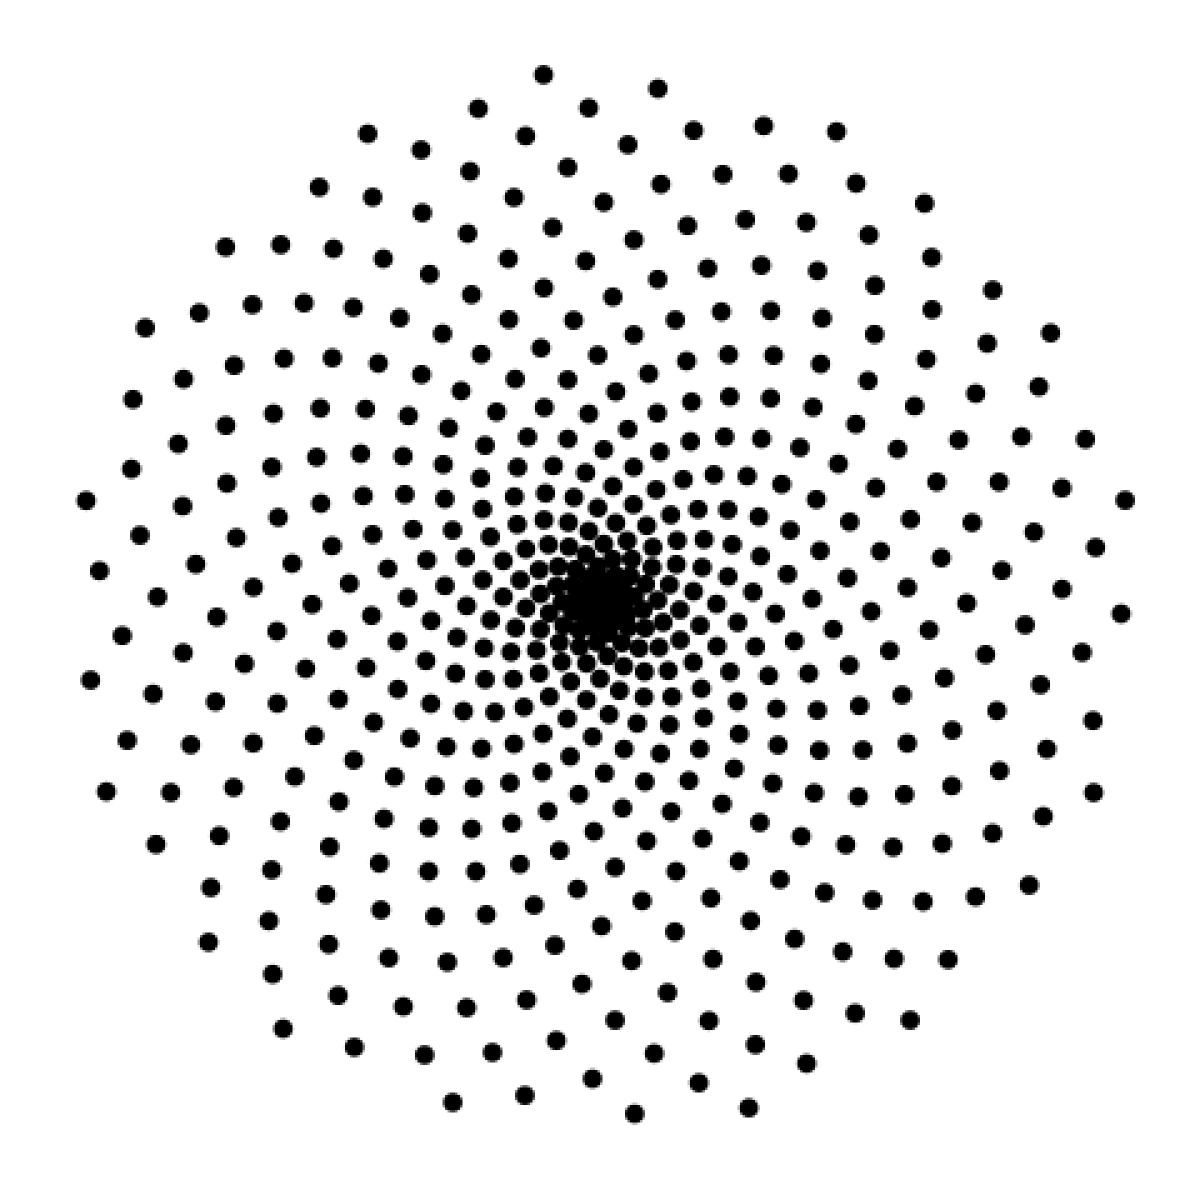
- Transform the circle into a spiral:
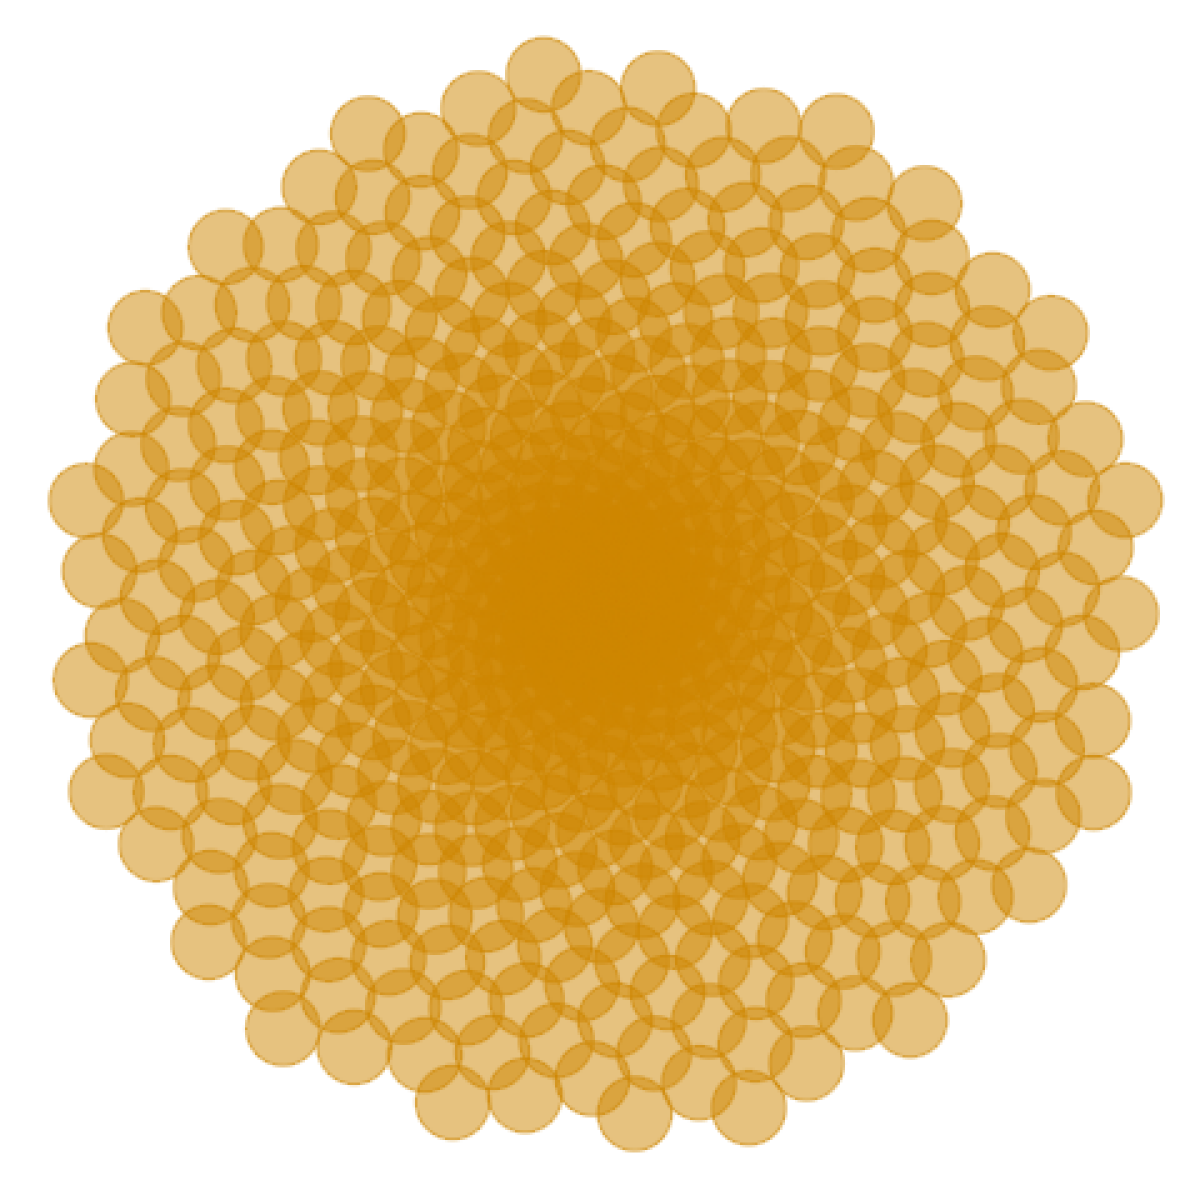
- Enhance with color and transparency:
- Experiment with different angles (here using 2):

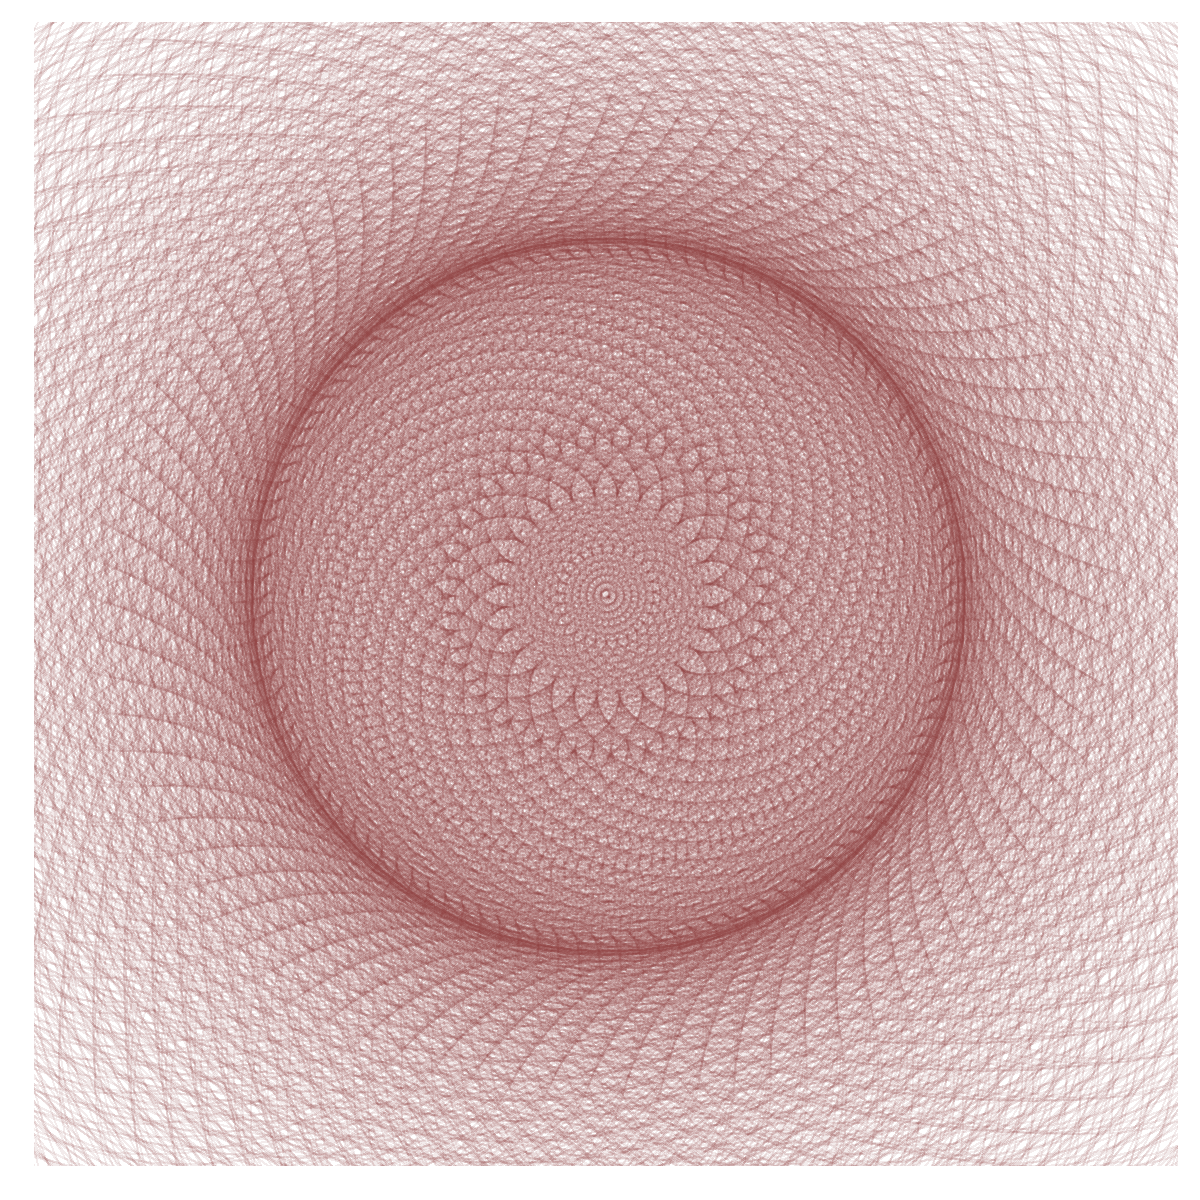
The Final Creation
Here’s the complete marigold, created with this simple code:
golden_angle <- 13 * pi/180
points <- 2000 # sweet spot with this ratio

t <- (1:points) * golden_angle
x <- sin(t)
y <- cos(t)
df <- data.frame(t, x, y)

ggplot(df, aes(x * t, y * t))+
   geom_point(size= 80, alpha= 0.1,
               shape= 1,
               color= "based on your preference")
   # Additional styling code...
Want to dive deeper into the mathematics? Check out these Pricenton notes. Special thanks to Mr. Antonio Sánchez Chinchón for the inspiration.
Happy Valentine’s Day! May we all share love and respect for one another.
NOTE: Found a mistake or have feedback? I’d love to hear from you - please reach out via email!