Creating the Mandelbrot Set Fractal
Nature’s patterns are hiding in mathematics. From DNA molecules to cosmic formations, these recurring designs can be explored through fractals - and it all began with the Mandelbrot Set.
(Curious about the implementation? Check out the source code here)
Understanding the Mathematics
At its core, the Mandelbrot Set is a collection of numbers with fascinating properties. The magic happens when we work with the expression:
F = {x² + c | x is any number, and -2 < x < 1}
This seemingly simple formula creates complex behavior due to two fundamental algebraic rules:
- When you multiply two negative numbers, you get a positive
- Adding a negative number is the same as subtracting its positive value
The Power of Complex Numbers
To prevent our calculations from exploding into infinity, we use complex numbers instead of real numbers. A complex number combines real and imaginary components, typically written as A + Bi. Here’s a quick example of converting to standard form:
2 + √(-9)
=> 2 + √(9 × -1)
=> 2 + √9 × √(-1)
=> 2 + 3 × √(-1)
=> 2 + 3i
Implementation in Code
Here’s how we bring this mathematical concept to life:
mandelbrot <<- function(i,j){
  # extra code
  x <- i-c # here c is some real number
  y <- c-j
  a <- complex(real = x/200, imaginary = y/200) #real numbers
  b <- complex(real = 0, imaginary = 0) #imaginary numbers
  # extra code
  for(...){
    b <- b*b+a # iterate over expression
    # extra code
  }
 # extra code
}
When plotted on a complex plane (where the x-axis represents real numbers and the y-axis represents imaginary numbers), numbers between -2 and 1 that don’t cause exponential growth create a distinctive pattern:
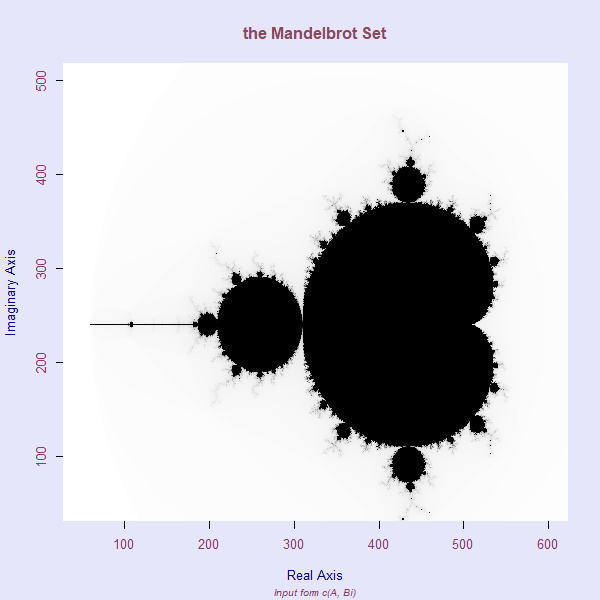
The Beautiful Result
The black region in the image shows the Mandelbrot Set itself. The varying colors around it (zoom in to see the pear-like patterns) represent numbers that “escaped” the set during different iterations. Each color band contains numbers that escaped at similar times, creating this stunning fractal pattern. Despite the relatively simple code, rendering this visualization took 4-5 hours - a testament to the computational complexity behind this mathematical beauty. Want to dive deeper into the fascinating world of the Mandelbrot Set? Check out the detailed Wikipedia article.
NOTE: Found a mistake or have feedback? I’d love to hear from you - please reach out via email!