Buddhabrot - From Chaos to Cosmic Beauty
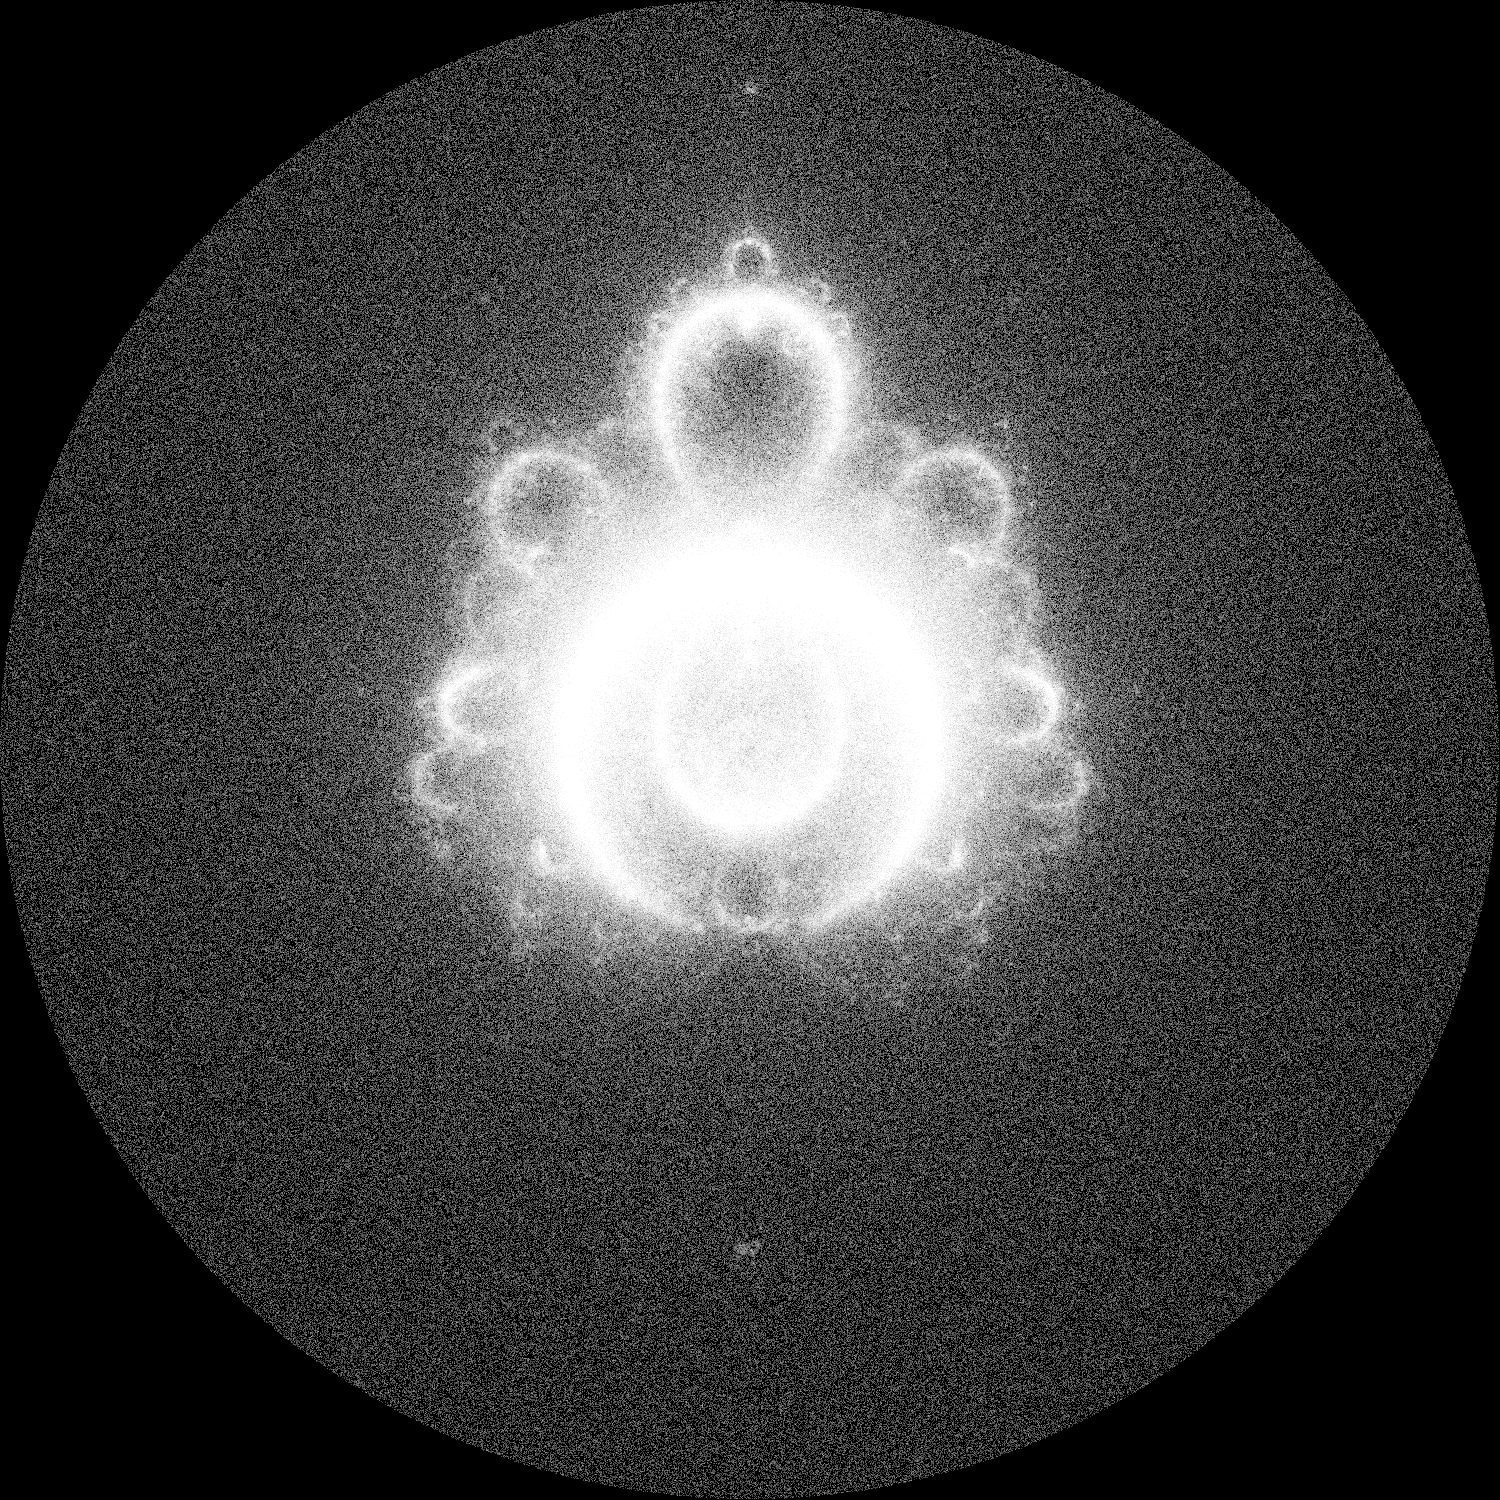
Deep within the field of generative art lies a fascinating fractal called the Buddhabrot, a hauntingly beautiful variation of the famous Mandelbrot set that reveals an unexpected resemblance to a sitting Buddha in meditation. But unlike the Mandelbrot, the Buddhabrot shows us the journey, not just the destination.
What Makes Buddhabrot Special?
The Buddhabrot, discovered by Melinda Green in 1993, is created by tracking the paths of escaping points in the complex plane, revealing a ghostly figure that emerges from mathematics. Imagine throwing thousands of digital particles into a mathematical wind tunnel and watching where they flow - that’s essentially what we’re doing here.
The Math Behind the Magic
The Buddhabrot uses the same mathematical foundation as the Mandelbrot set- z = z² + c. However, instead of just checking whether points escape, we’re interested in the actual paths they take before escaping. The code I’m sharing here implements this process in R and C++ for better performance, using parallel processing to generate millions of paths with thousands of iterations.
Some awesome technical details:
- The algorithm uses a combination of R and C++ through Rcpp for optimal performance
- Each point’s journey is tracked until it either escapes or reaches the maximum iteration limit
- The resulting image is created by accumulating these paths into a density map
- The logarithmic scaling of the final image helps reveal subtle details in the structure
Hidden Features
One of the most cool aspects of the Buddhabrot is how it reveals different structures at different iteration depths. Running the algorithm with different maximum iteration counts reveals distinct layers of the image:
- Short iterations (100-1000) reveal the outer “glow”
- Medium iterations (1000-5000) show the main body structure
- Long iterations (50000+) expose incredibly detailed filaments
Fun Facts
- The name “Buddhabrot” comes from its resemblance to a seated Buddha figure, though this wasn’t noticed until years after its mathematical properties were first studied.
- If you color different escape-time ranges differently, you can create a “Nebulabrot” variation that looks remarkably like a cosmic nebula.
- The rendering technique used here inspired several other fractal rendering methods in computer graphics.
The code provided implements an optimized version of the Buddhabrot or at least as optimal as I was able to make it). It is using parallel processing to generate millions of points efficiently. Each run creates a unique image, as the algorithm uses random sampling to explore the complex plane.
# C++ function for complex number iteration
escaped <- function(c, max_iter) {
  # ... (C++ implementation)
}

buddhabrot <- function(iterations, size, max_iter) {
  points_matrix <- matrix(0, nrow = size, ncol = size)

  # Set up parallel processing
  # ...

  for (batch in 1:num_batches) {
    results <- foreach(i = 1:batch_size) %dopar% {
      c_point <- complex(real = runif(1, -2, 2), imaginary = runif(1, -2, 2))
      escaped(c_point, max_iter)
    }

    # Process results and update points_matrix
    # ...
  }

  # Normalize and save image
  points_matrix <- log(points_matrix + 1)
  writePNG(points_matrix/max(points_matrix), "Buddhabrot_Optimized.png")
}

# Execute the function
buddhabrot(iterations = 1e6, size = 1500, max_iter = 1500)
Next time you run this code, remember, you’re not just generating a mathematical visualization - you’re revealing a hidden universe where chaos and order work together to create something truly extraordinary.